Build a Command Center Dashboard With Claude
Generate a fully custom-coded dashboard that tracks your business metrics in one view
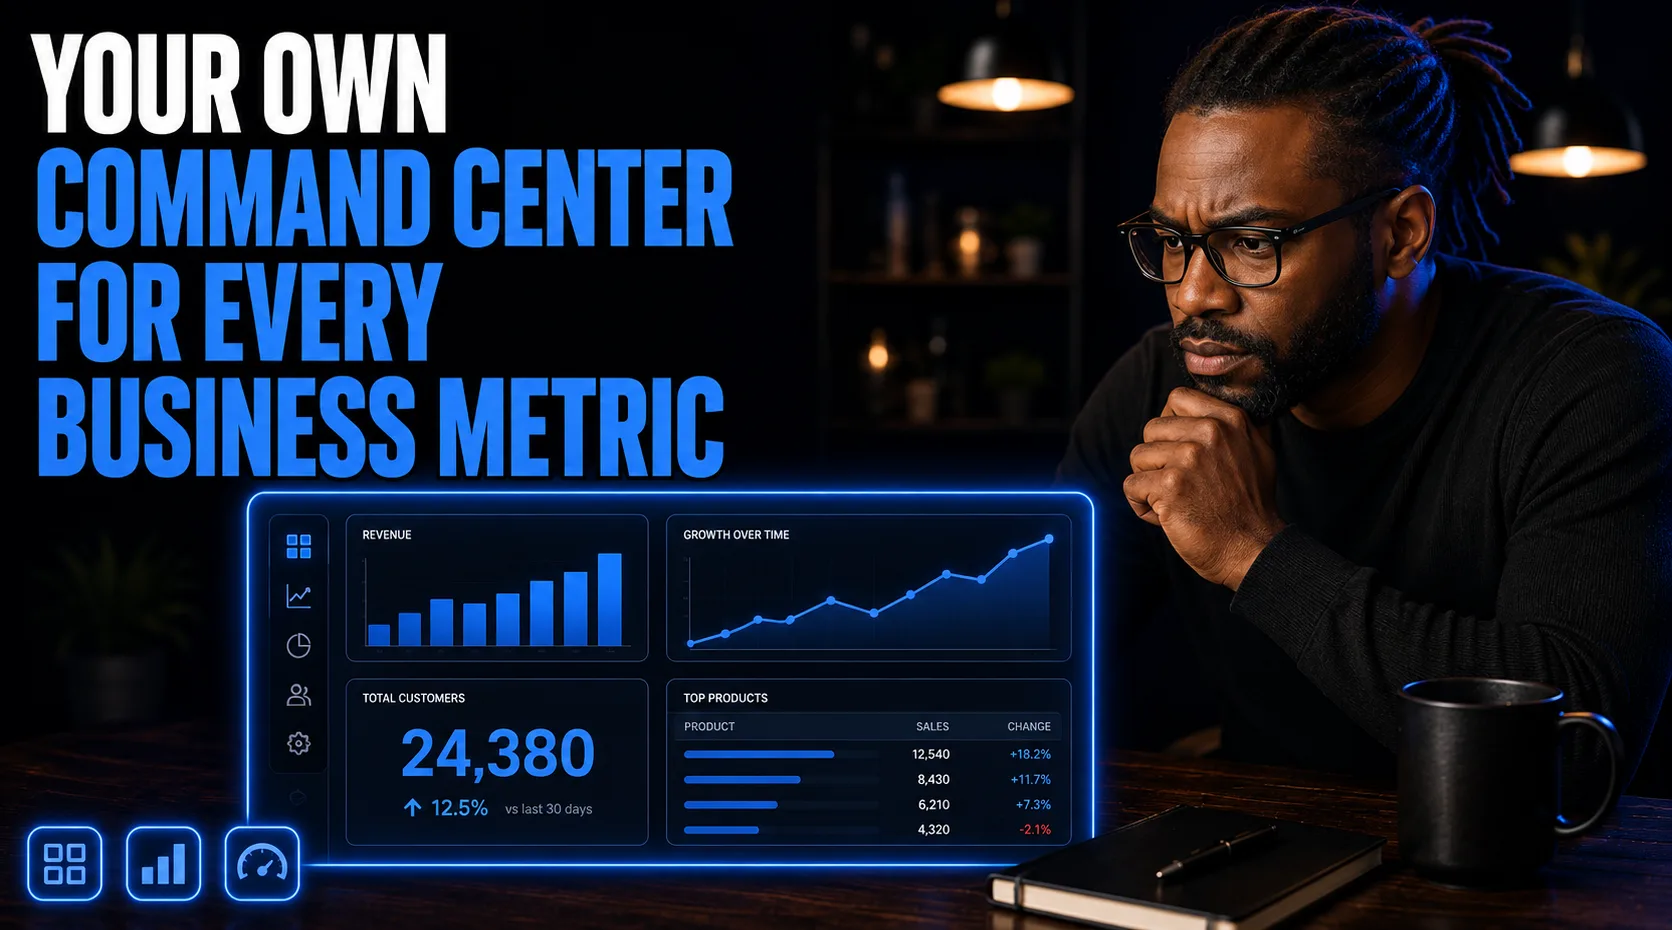
One View for Every Metric That Matters
Why a custom dashboard beats stitching together spreadsheets and paid BI tools
Most founders track performance across five open tabs — a social analytics dashboard, a revenue spreadsheet, a podcast host's stats page, a goals doc. None of it talks to each other, and updating it is a manual chore every single morning. This guide uses Claude as a full-stack developer to generate a custom 'Command Center' dashboard that aggregates all of it into one view, without touching a paid BI tool or stitching together spreadsheets by hand. You give Claude your metrics, your goal for the dashboard, your aesthetic preference, and your tech comfort level, and it returns the architecture, a system prompt for keeping Claude in the developer role going forward, the data integration logic for your real sources, and an MVP setup script — everything needed to run your own private dashboard locally, tailored to exactly what you track.
Command Center Dashboard Build Prompt
BUILD PROMPT:
Act as a Senior Full-Stack Developer and Data Visualization expert. I want to build a custom 'Command Center' dashboard to track my business metrics (e.g., social media growth, revenue, podcast stats, and goal tracking). Based on the project details I provide, generate: 1. Dashboard Architecture: a breakdown of the necessary tech stack (e.g., React/Next.js), data ingestion logic, and component structure for a clean, visual interface. 2. System Prompt for Coding: a detailed system prompt to train Claude to act as my developer, ensuring it maintains the code, adds features, and handles data visualization components correctly. 3. Data Integration Logic: clear pseudo-code or step-by-step logic on how to connect my data sources (e.g., APIs, CSV imports, or manual input forms) to the dashboard. 4. MVP Setup Script: a 3-step technical script to get the local environment running, defining the initial file structure and essential dependencies. Format these outputs as distinct, copy-pasteable blocks so I can drop them straight into my project files. Here is my campaign data: [primary metrics to track], [core goal of dashboard], [dashboard aesthetic], [tech experience level].

REFINEMENT PROMPTS:
"Convert this dashboard code into a concise script suitable for a local development server."

"Add a conditional branching step to the display: if a metric hits a certain goal, trigger a congratulatory visual or automated alert."

"Give me 5 layout variations for the dashboard to run an A/B test on which data view is most efficient for my morning routine."